
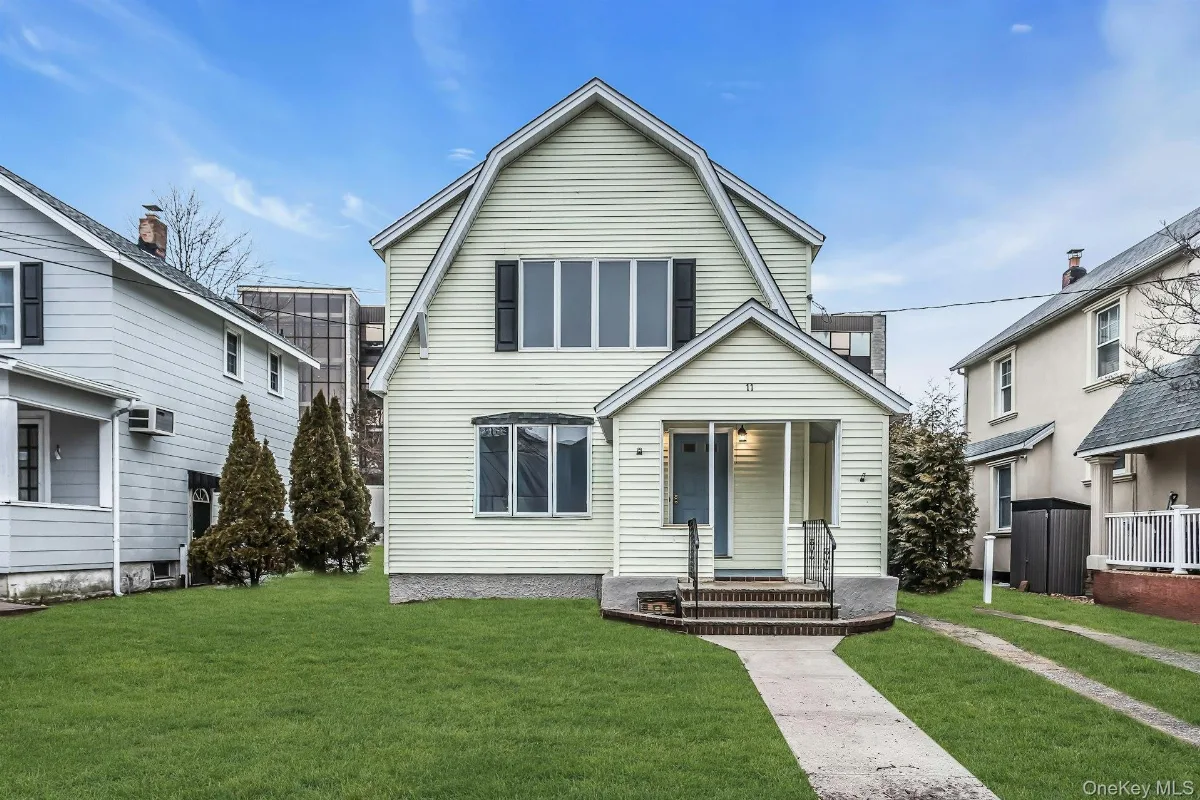
11 Merton Avenue, Lynbrook, NY 11563
$779,000 · 3 bed · 2 bath · 1,822 sq ft · built 1928 · MLS# 1017044 · Active
We are proud to introduce this charming property nestled in a mid-block street. It Offers An Exceptional Blend Of Comfort, Quality, Value And Convenience. The Open Floor Plan Links The Spacious Living Room To The Family Room, Surrounded By Large Bay Windows. High Ceilings, Skylight, Flooding The House With Natural Light; Makes Living Very enjoyable. A Half Bath Is Also Available At Your Finger Tip. Whether You Are A Chef Or A Novice, A Totally Renovated Kitchen With Solid New Cabinetry and New Appliances Welcomes Anyone Who Wants To Practice…
Single-family homes in the East Rockaway Union Free School District sold for a median of $705,000 (typically $605,000–$800,000) across 78 recorded sales between Oct 10, 2025 and Oct 1, 2026, up 10.2% on the 12 months before. This home's $779,000 list price sits in the upper single-family tier for the East Rockaway Union Free School District.
ZIP 11563 has about 3 months of single family inventory — seller's market. Demand is outpacing supply, so homes sell quickly with firm pricing and limited room to negotiate.
At about $16,013 a year, this home's property tax runs roughly 23% above the $13,000 typical for East Rockaway Union Free School District. Nassau assessments run on a multi-year cycle, so the assessed value behind this bill can lag what the home actually sells for today. A sale does not automatically reset it, and exemptions such as STAR, Senior or Veteran move the number as well — a new owner's bill is often not the same as the seller's.
OneKey MLS (recorded LI sales, trailing 12mo) + actual tax
Listings courtesy of OneKey® MLS as distributed by MLS GRID.
Based on information submitted to the MLS GRID as of October 11, 2026 2:30 am. All data is obtained from various sources and may not have been verified by broker or MLS GRID. Supplied Open House Information is subject to change without notice. All information should be independently reviewed and verified for accuracy. Properties may or may not be listed by the office/agent presenting the information.
Personal-use terms and which listings this site shows: MLS & Data Disclosures
Lynbrook Market Trend
The past 2 years in Lynbrook has been defined by stability: median sale prices have ranged only from $434K to $815K, holding near $722K without a single direction winning out. Recently, homes have been selling in about 48 days. It's also worth noting that the roughly $722K blended median combines very different property types, so it may not describe any single one: of 409 recent sales, single-family made up the largest share at about 60% with a median near $760K, co-ops about 19% near $320K, multi-family (2-4 family) about 13% near $840K, condos about 8% near $390K. Because co-ops, though not the most common, is priced far enough from the rest to pull the blend down, the blended figure tends to sit below the single-family median rather than above it — so a typical single-family house has tended to sell closer to $760K, roughly $38K over the headline number, even though the higher-priced multi-family (2-4 family) in the mix pull the other way but at about 13% are too small a share to offset that drag. These are past medians, not predictions or guarantees, and individual properties vary widely; anyone weighing a specific property should review current comparable sales for that property type.
More homes nearby
- All homes for sale in Lynbrook, NY
- Homes for sale in Nassau County, NY
- All Long Island & NYC listings
- Homes in ZIP 11563
Looking for off-market opportunities or a property attorney's read on this listing? Contact Joseph DeVito — Lic. R.E. Associate Broker + NY-licensed real estate attorney.