
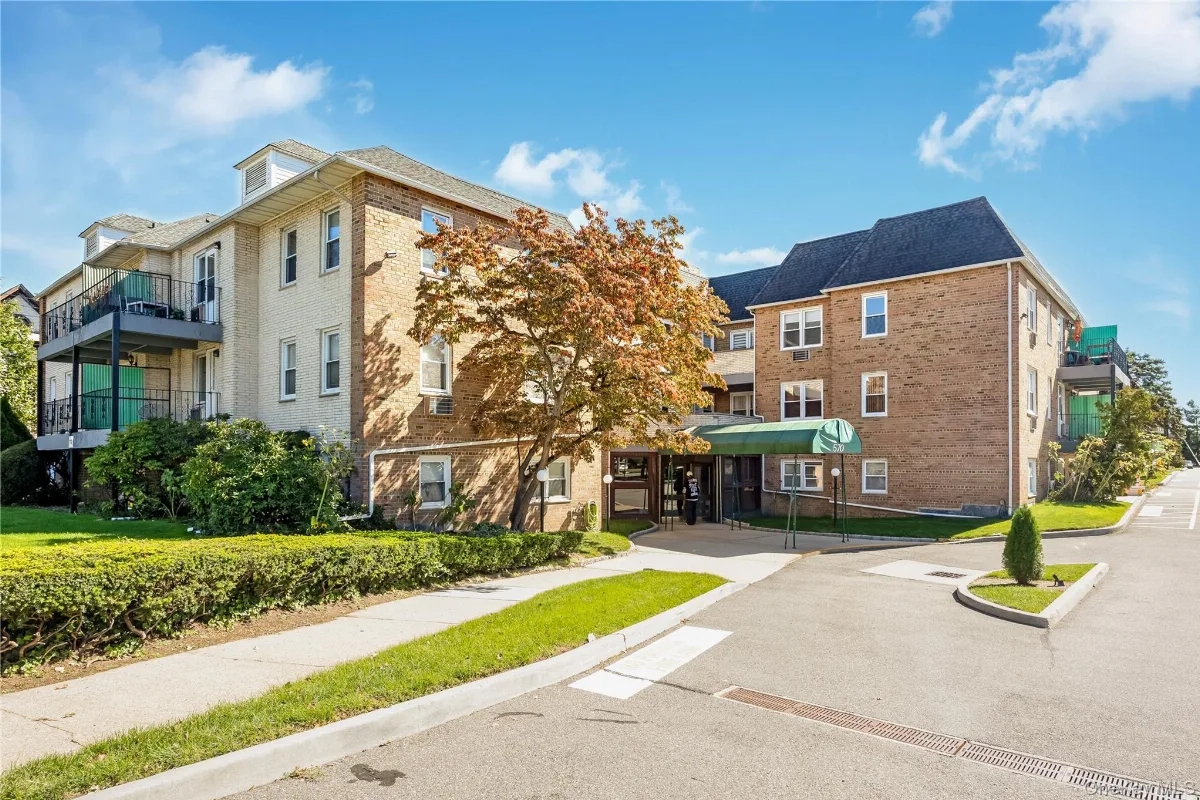
570 Broadway #B11, Lynbrook, NY 11563
$450,000 · 2 bed · 1 bath · 964 sq ft · built 1968 · MLS# 1053813 · Active
Step inside this charming condo located in the desirable area of Lynbrook. This well-maintained residence offers comfortable layout with spacious 2 bedrooms, 1 bath, a bright living area, kitchen and dining area. Enjoy community amenities including an elevator building, a swimming pool and on-site laundry, along with one assigned parking spot, storage and bike room in the bldg. Conveniently located near shopping, dining, parks, schools, and transportation. A great opportunity to enjoy comfortable and convenient condo living in Lynbrook School district D #20. Just minutes to the Long Island Railroad…
Condos in the Lynbrook Union Free School District sold for a median of $385,000 (typically $350,000–$510,000) across 17 recorded sales between Oct 23, 2025 and Aug 26, 2026, down 13.5% on the 12 months before.
ZIP 11563 has about 1.3 months of condo inventory — hot seller's market. Severe inventory shortage — homes sell fast and often draw multiple offers over asking, giving sellers maximum leverage.
At about $7,779 a year, this home's property tax runs roughly 11% above the $7,000 typical for Lynbrook Union Free School District. Nassau assessments run on a multi-year cycle, so the assessed value behind this bill can lag what the home actually sells for today. A sale does not automatically reset it, and exemptions such as STAR, Senior or Veteran move the number as well — a new owner's bill is often not the same as the seller's.
OneKey MLS (recorded LI sales, trailing 12mo) + actual tax

Listings courtesy of OneKey® MLS as distributed by MLS GRID.
Based on information submitted to the MLS GRID as of October 11, 2026 3:30 am. All data is obtained from various sources and may not have been verified by broker or MLS GRID. Supplied Open House Information is subject to change without notice. All information should be independently reviewed and verified for accuracy. Properties may or may not be listed by the office/agent presenting the information.
Personal-use terms and which listings this site shows: MLS & Data Disclosures
Lynbrook Market Trend
The past 2 years in Lynbrook has been defined by stability: median sale prices have ranged only from $434K to $815K, holding near $722K without a single direction winning out. Recently, homes have been selling in about 48 days. It's also worth noting that the roughly $722K blended median combines very different property types, so it may not describe any single one: of 409 recent sales, single-family made up the largest share at about 60% with a median near $760K, co-ops about 19% near $320K, multi-family (2-4 family) about 13% near $840K, condos about 8% near $390K. Because co-ops, though not the most common, is priced far enough from the rest to pull the blend down, the blended figure tends to sit below the single-family median rather than above it — so a typical single-family house has tended to sell closer to $760K, roughly $38K over the headline number, even though the higher-priced multi-family (2-4 family) in the mix pull the other way but at about 13% are too small a share to offset that drag. These are past medians, not predictions or guarantees, and individual properties vary widely; anyone weighing a specific property should review current comparable sales for that property type.
More homes nearby
- All homes for sale in Lynbrook, NY
- Homes for sale in Nassau County, NY
- All Long Island & NYC listings
- Homes in ZIP 11563
Looking for off-market opportunities or a property attorney's read on this listing? Contact Joseph DeVito — Lic. R.E. Associate Broker + NY-licensed real estate attorney.