
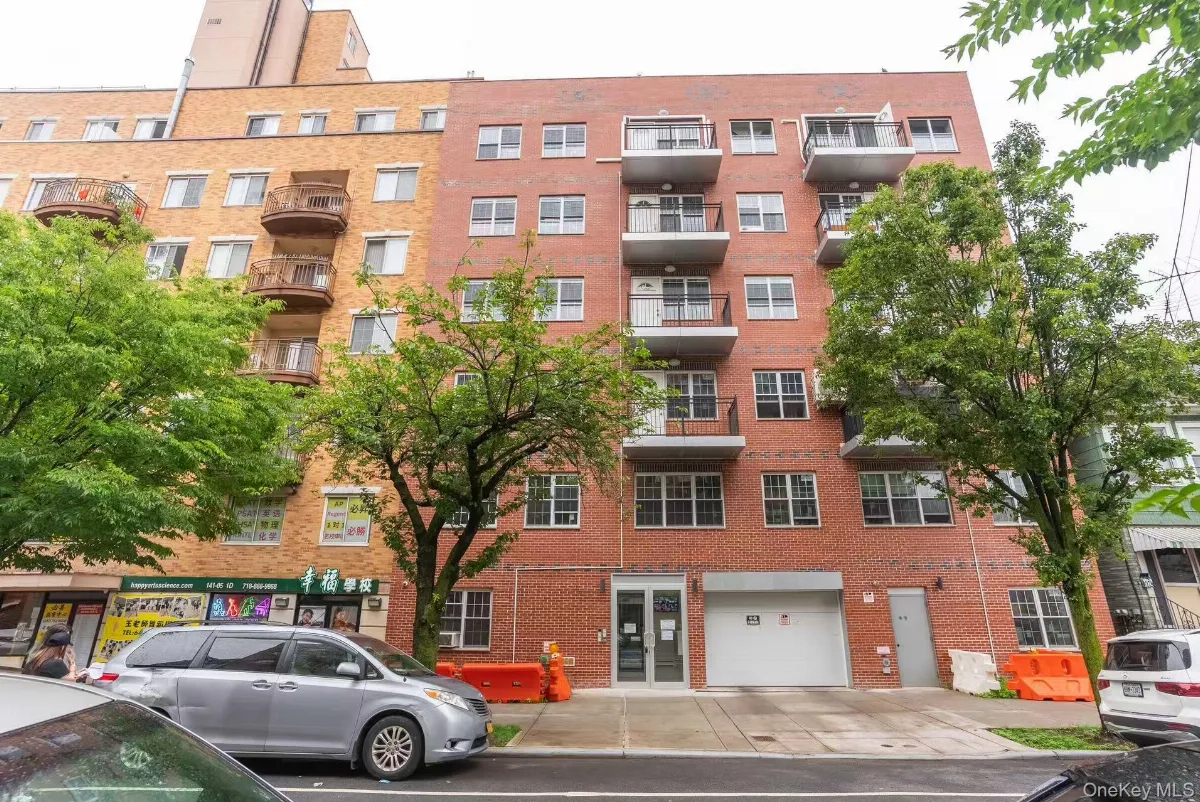
141-15 Cherry Avenue #3C, Flushing, NY 11355
$468,000 · 1 bed · 1 bath · 460 sq ft · built 2023 · MLS# 1056298 · Active
The layout is exquisite and square, with high space utilization. It features solid wood flooring and good sound insulation. The area is 460 square meters with a 40-square-meter balcony. The building is equipped with a surveillance system and a video intercom system. There is a parking garage on the first floor. In the basement, there is a room, a gym. Large elevator and the large restroom that are convenient for wheelchair access. Brand new AC units in living room and bedroom. Superior location, convenient life. The block is within walking…
Condos in ZIP 11355 sold for a median of $620,000 (typically $550,000–$705,000) across 143 recorded sales between Oct 6, 2025 and Sep 28, 2026, up 0.2% on the 12 months before. This home's $468,000 list price sits in the entry condo tier for ZIP 11355.
At about $5,526 a year, this home's property tax is in line with the roughly $6,000 typical for ZIP 11355. Exemptions such as STAR, Senior or Veteran change what is actually billed, so a new owner's bill is often not the same as the seller's.
OneKey MLS (recorded Queens sales, trailing 12mo) + actual tax
Listings courtesy of OneKey® MLS as distributed by MLS GRID.
Based on information submitted to the MLS GRID as of October 10, 2026 9:45 pm. All data is obtained from various sources and may not have been verified by broker or MLS GRID. Supplied Open House Information is subject to change without notice. All information should be independently reviewed and verified for accuracy. Properties may or may not be listed by the office/agent presenting the information.
Personal-use terms and which listings this site shows: MLS & Data Disclosures
Flushing Market Trend
Month-to-month medians in Flushing have been uneven across the past 2 years, ranging anywhere from $450K to $737K — more indicative of a thin or property-mix-driven market than of a single direction. Recently, homes have been selling in about 62 days. Part of why that median has moved unevenly month to month is mix shift — which property types happen to sell. The roughly $620K blended median combines very different types, so a stretch heavy on multi-family (2-4 family) (around $1.53M) versus one heavy on co-ops (around $370K) can swing the all-types figure on its own, independent of any change in value. Of 647 recent sales, condos made up the largest share at about 48% with a median near $619K, co-ops about 26% near $370K, multi-family (2-4 family) about 13% near $1.53M, single-family about 13% near $1.15M. Because co-ops, though not the most common, is priced far enough from the rest to pull the blend down, the blended figure tends to sit below the single-family median rather than above it — so a typical single-family house has tended to sell closer to $1.15M, roughly $525K over the headline number, even though the higher-priced multi-family (2-4 family) in the mix pull the other way but at about 13% are too small a share to offset that drag. These are past medians, not predictions or guarantees, and individual properties vary widely; anyone weighing a specific property should review current comparable sales for that property type.
More homes nearby
Looking for off-market opportunities or a property attorney's read on this listing? Contact Joseph DeVito — Lic. R.E. Associate Broker + NY-licensed real estate attorney.