
Flood insurance costs and FEMA flood data for Nassau, Suffolk, Queens and Brooklyn
What homeowners pay for NFIP flood insurance, what share of residential buildings carry it, and how FEMA rates expected flood losses, county by county. Every figure is calculated from FEMA public data; FEMA's own labels are quoted as FEMA publishes them.
Policies in force on August 31, 2026 · FEMA policy data as of September 8, 2026 · FEMA National Risk Index, December 2025 release
By county
Costs: single-family NFIP policies in force on August 31, 2026; "yearly cost" is premium plus FEMA fees. Insured share: FEMA's NFIP residential penetration rate, residential contracts in force as a share of all residential buildings, as of August 3, 2026.
| County | Residential buildings insured | Median yearly cost |
|---|---|---|
| Nassau County | 9.7% | $1,510 |
| Suffolk County | 5.4% | $1,400 |
| Queens | 3.7% | $1,320 |
| Brooklyn | 2.9% | $1,130 |
Nassau County →
In Nassau County, the typical monthly median yearly cost of single-family NFIP policies taking effect in June through August 2026 was $1,600, 8% higher than the typical month in June through August 2025 ($1,470). Based on 8,380 and 8,745 policies.
Suffolk County →
In Suffolk County, the typical monthly median yearly cost of single-family NFIP policies taking effect in June through August 2026 was $1,410, 14% higher than the typical month in June through August 2025 ($1,230). Based on 6,422 and 6,811 policies.
Queens →
In Queens, the typical monthly median yearly cost of single-family NFIP policies taking effect in June through August 2026 was $1,400, 17% higher than the typical month in June through August 2025 ($1,200). Based on 2,038 and 2,106 policies.
Brooklyn →
In Brooklyn, the typical monthly median yearly cost of single-family NFIP policies taking effect in June through August 2026 was $1,120, 4% higher than the typical month in June through August 2025 ($1,080). Based on 1,031 and 1,080 policies.
How NFIP flood insurance is priced
Standard homeowners policies exclude flood. Flood coverage is bought separately, from FEMA's National Flood Insurance Program (NFIP) or a private insurer. When a mortgage comes from a federally regulated or insured lender and the building sits in a FEMA high-risk zone, the lender requires it.
Since 2021 FEMA prices each building individually under Risk Rating 2.0. The factors include distance to water, the type and frequency of flooding, the foundation type, the height of the lowest floor, prior claims and the cost to rebuild. That is why two homes on the same street can pay different amounts, and why the figures on these pages are ranges, not quotes.
Flood zones, and how to check an address
FEMA's flood maps divide land into zones. Zones beginning with A or V are high-risk Special Flood Hazard Areas; V zones also face storm waves. X, B and C zones are moderate- to low-risk, and floods happen there too. A property's zone comes from the official map for its address, not from a town or ZIP average.
FEMA flood-loss ratings by census tract
FEMA's National Risk Index rates each census tract's expected yearly losses from flooding against every census tract in the country. Counts of tracts under each FEMA label:
Nassau County · 281 tracts
Coastal flooding
- Very High 8
- Relatively High 38
- Relatively Moderate 16
- Relatively Low 18
- Very Low 22
- No expected annual losses 179
Inland flooding
- Very High 3
- Relatively High 36
- Relatively Moderate 108
- Relatively Low 119
- Very Low 15
Suffolk County · 384 tracts
Coastal flooding
- Very High 10
- Relatively High 51
- Relatively Moderate 37
- Relatively Low 19
- Very Low 27
- No expected annual losses 240
Inland flooding
- Relatively High 19
- Relatively Moderate 112
- Relatively Low 195
- Very Low 58
Queens · 724 tracts
Coastal flooding
- Very High 4
- Relatively High 14
- Relatively Moderate 36
- Relatively Low 30
- Very Low 39
- No expected annual losses 601
Inland flooding
- Relatively High 8
- Relatively Moderate 44
- Relatively Low 238
- Very Low 433
- No expected annual losses 1
Brooklyn · 804 tracts
Coastal flooding
- Relatively High 4
- Relatively Moderate 39
- Relatively Low 51
- Very Low 41
- No expected annual losses 669
Inland flooding
- Relatively High 1
- Relatively Moderate 21
- Relatively Low 264
- Very Low 511
- No expected annual losses 7
Flood-insurance claims by major storm
NFIP claims by the event name FEMA records, for each county, from FEMA's NFIP claims file (OpenFEMA, as of September 8, 2026). All building types, all years on record. A claim is one insured building's flood loss. Only buildings that carried NFIP insurance appear, so these counts are not a count of every flooded home.
Nassau County
- Hurricane Sandy (2012): 26,964 claims
- Hurricane Irene (2011): 6,080 claims
- December Storm - Nor'easter (1992): 3,619 claims
Suffolk County
- Hurricane Sandy (2012): 13,168 claims
- December Storm - Nor'easter (1992): 3,157 claims
- Hurricane Irene (2011): 2,151 claims
Queens
- Hurricane Sandy (2012): 7,640 claims
- Hurricane Irene (2011): 1,221 claims
- December Storm - Nor'easter (1992): 1,030 claims
Brooklyn
- Hurricane Sandy (2012): 3,561 claims
- December Storm - Nor'easter (1992): 282 claims
- Hurricane Ida (2021): 236 claims
Selling or renting in New York: flood disclosure
Since March 20, 2024, New York's Property Condition Disclosure Statement asks sellers about a home's flood history: whether the property is in a FEMA flood zone, whether it carries flood insurance, whether flood-insurance claims were filed, and whether federal flood assistance was received. The earlier option of giving the buyer a $500 credit instead of the statement ended at the same time. Residential leases carry their own flood disclosure under Real Property Law §231-b.
This is general information, not legal advice. Sellers and landlords should confirm their obligations with their attorney.
Flooding in the news
- Long Island will keep flooding. What's the plan?
- Nor’easter brings flooding, erosion and strong winds to Long Beach
- CM Ariola calls for ‘major infrastructure overhaul’ to combat flooding after weekend storm wreaks havoc in south Queens – QNS
- Nor’easter topples trees, floods streets
- Floods hit Hamilton, Howard Beach again
- East End communities continue to deal with flooding after nor'easter
- Stubborn 3-day nor'easter lurches off Long Island, leaving 2,000 fallen trees, flooding, outages in wake
- Nor'easter leaves behind flooded homes, businesses, and badly damaged dunes along Long Beach Island
Videos
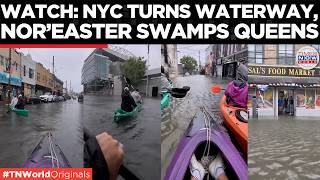 NYC FLOOD CHAOS: New Yorkers Kayak Through Queens Streets Amid Powerful Nor’easter | Times Now World
 Nor'easter slams NYC area: Severe coastal flooding, high winds continue
 Long Island nor'easter update: More flooding expected on South Shore
 Heavily Flooded Howard Beach Queens Streets during Nor'easter Sunday Coastal Flood
 'They got to fix the sewers.' Flooding strikes again in southern Queens
 POWERFUL NOR’EASTER SLAMS NEW YORK – Coney Island & Long Island FLOODED (Latest Updates)
Frequently asked questions
How much does flood insurance cost in Nassau, Suffolk, Queens and Brooklyn?
Median yearly cost of NFIP policies on single-family homes in force on August 31, 2026: Nassau County $1,510 (32,430 policies); Suffolk County $1,400 (24,706 policies); Queens $1,320 (7,909 policies); Brooklyn $1,130 (4,057 policies). That is premium plus FEMA fees. Each building is priced individually, so a quote for a specific home can differ.
What share of residential buildings have NFIP flood insurance?
Residential NFIP contracts in force as a share of all residential buildings (every type, not only single-family), from FEMA's NFIP residential penetration rates as of August 3, 2026: Nassau County 9.7%; Suffolk County 5.4%; Queens 3.7%; Brooklyn 2.9%. Private flood policies are not included.
Does a standard homeowners policy cover flood damage?
No. Standard homeowners policies exclude flood damage. Flood coverage is bought separately, through the National Flood Insurance Program (NFIP) or from a private flood insurer.
When is flood insurance required?
When a mortgage comes from a federally regulated or insured lender and the building sits in one of FEMA's high-risk flood zones (a Special Flood Hazard Area, zones beginning with A or V), the lender requires flood insurance. Outside those zones it is optional, and lenders may still require it.
How is NFIP flood insurance priced?
Since 2021 FEMA prices each building individually under Risk Rating 2.0, using factors such as distance to water, the type and frequency of flooding, the foundation type, the height of the lowest floor, prior claims and the cost to rebuild. Two homes on the same street can pay different amounts.
How do I find the flood zone for a specific address?
Search the address on FEMA's Flood Map Service Center (msc.fema.gov). In Queens and Brooklyn, NYC's Flood Hazard Mapper and FloodHelpNY also show current and future flood zones.
How these figures are measured
- Yearly cost
- FEMA's "policy cost": the premium plus FEMA fees and surcharges, which is what the policyholder pays. Median and middle half (25th to 75th percentile), rounded to the nearest $10.
- Which policies
- NFIP policies on single-family homes (FEMA occupancy type 11) in force on August 31, 2026, from FEMA's OpenFEMA policy file as of September 8, 2026. Condo buildings, multi-unit buildings and commercial policies are left out so they cannot move a home figure. Private flood insurance is not in FEMA's data.
- Trend
- Monthly medians of policies by the month they took effect. The direction compares the latest months with the same calendar months a year earlier, using the same engine as the site's market trends, and states both periods.
- Residential buildings with NFIP insurance
- FEMA's NFIP residential penetration rate: residential NFIP contracts in force divided by all of the county's residential structures (every residential building type, not only single-family), on FEMA's own as-of date.
- County of a ZIP code
- FEMA's policy file carries ZIP codes but no county, so each whole ZIP is assigned to the county where most of its FEMA claims are recorded (else by its USPS prefix). A ZIP that crosses a county line is counted in one county.
- Claims (hub only)
- FEMA's NFIP claims file, all building types and years, grouped by the event name FEMA records.
- FEMA flood-loss ratings
- FEMA National Risk Index (December 2025 release), Expected Annual Loss rating for coastal and inland flooding, by census tract. FEMA also publishes a composite "Risk Index" that scales expected losses by community social-vulnerability and resilience scores, which are built from demographic data. These pages show only the expected-loss ratings, which rest on physical exposure and loss history.
- Small samples
- Figures based on fewer than 20 policies are shown and marked "small sample".
Sources: FEMA National Flood Insurance Program policy data (OpenFEMA, as of September 8, 2026); FEMA NFIP residential penetration rates; FEMA National Risk Index (December 2025 release); FEMA NFIP claims data (OpenFEMA, as of September 8, 2026). Medians, ranges and trends are calculated from those records; FEMA's ratings and labels are quoted as FEMA publishes them. "Yearly cost" is what the policyholder pays: premium plus FEMA fees and surcharges, for single-family homes only. The insured share is FEMA's residential NFIP contracts in force as a share of all residential buildings. NFIP policies only; private flood insurance is not included. This is not a flood-zone determination, insurance advice or a quote; under FEMA's Risk Rating 2.0 each building is priced individually. Check a specific address with FEMA's Flood Map Service Center and get a quote from a licensed insurance professional.
The DeVito Team compiled these figures from FEMA public data. Joseph DeVito, NY Licensed Associate Real Estate Broker. This is general information, not legal, insurance or flood-risk advice.