
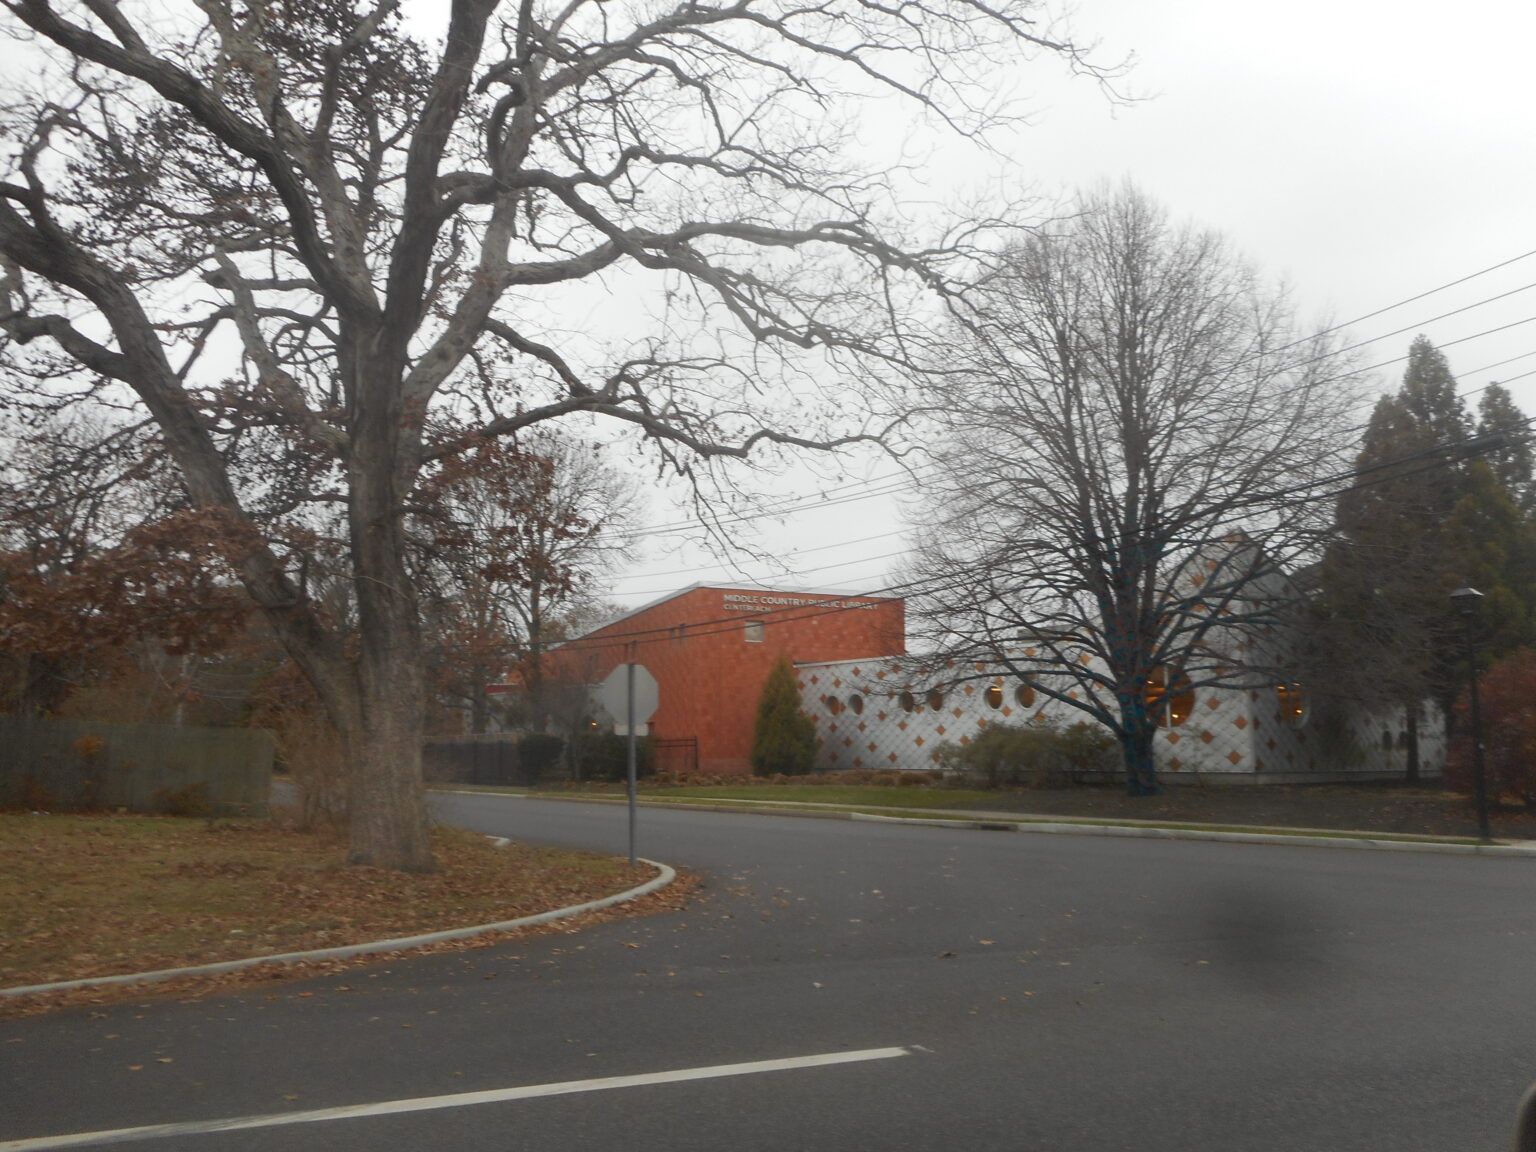
Living in Centereach
Key metrics and insights for homebuyers and sellers evaluating Centereach, Suffolk, NY 11720.
How far is Centereach from New York City by train?
From St. James Station on the LIRR Port Jefferson Branch, scheduled weekday AM-peak service takes about 84 minutes to Penn Station, 87 minutes to Grand Central Madison, 88 minutes to Atlantic Terminal in Brooklyn (MTA LIRR timetable data).
Is Centereach walkable?
Centereach has a Walk Score of 21 out of 100, which Walk Score rates "Car-Dependent".
Nearby Long Island Rail Road stations and typical weekday AM-peak travel times to the Manhattan and Brooklyn terminals. Many Centereach residents use whichever station best fits their branch and schedule.
AM-peak travel times on scheduled LIRR service to Penn Station, Grand Central Madison, and Atlantic Terminal (Brooklyn). Based on MTA LIRR public timetable data.
Centereach Market Data
Current market conditions and pricing trends for Centereach, Suffolk, NY.
Single-family, condo and co-op homes are measured separately — these medians are never blended together. Based on 243 recorded closings in ZIP 11720 between Sep 18, 2025 and Sep 18, 2026 — a settled trailing twelve months, ending about a month back so late-recorded closings are counted rather than missed. Days on market are medians, not averages. A property type with fewer than 8 closed sales in that window is left out rather than published on a sample too thin to mean anything.
Single-family prices in ZIP 11720 are up about 6% year over year, comparing 241 sales in the 12 months to September 18, 2026 with 248 in the 12 months to September 18, 2025. Over the past 2 years, single-family monthly median sale prices in ZIP 11720 have ranged from $560K to $709K.
Based on information from OneKey® MLS, for the period October 17, 2025 through October 1, 2026. Source: OneKey MLS (recorded LI sales, trailing 12mo) + actual tax. Based on 516 recorded sales. Property tax values shown are algorithmic estimates calculated from official NY State ORPS / NYC Department of Finance assessment data aggregated by school district (Long Island) or ZIP code (NYC). These figures are an educational baseline and do not represent a guaranteed or binding tax bill. Actual taxes vary based on individual assessed value, applicable exemptions (STAR, Senior, Veteran), historical grievances, village overlays, and special district levies. Verify exact tax with the Nassau County Assessor / Suffolk County Comptroller / NYC Department of Finance before any financial commitment.
Across 8 years of county-clerk records, 651 homes in the Middle Country school district were bought by a company and resold within two years. Over the whole period the typical one was bought for $250,000 and resold for $410,000, a median of 7.1 months later.
That difference is gross. Renovation, carrying, financing and selling costs are not recorded anywhere public, so it is the change in price, not a profit. Over a hold of that length prices across the county moved about +4.4%, so most of the difference is not the market carrying the house.
What these homes resold for moved from a median of $305,000 in 2017 to $570,000 in 2024, up about 87% over the period.
The pandemic years cut against the intuition that investors moved in. Companies bought 13.8% of homes here in 2019, then 10.6% in 2020 and 6.6% in 2021 — the lowest share of the 8 years. In those two years companies won a smaller share, not a larger one. The number bought and resold within two years fell with it, from 101 in 2019 to 64 in 2021.
Since then it has reversed. Company buying reached 14.5% in 2024 — above its 2019 level of 13.8%.
In 2025, 54 homes in the Middle Country school district were resold by a company that had bought them within the previous two years. They were bought for a median of $382,000 and resold for a median of $615,000. Measured house by house, the typical resale was 50% above what that same buyer had paid, a median of 5.3 months earlier.
That difference is gross. Renovation, carrying, financing and selling costs are not recorded anywhere public, so it is the change in price, not a profit. Over a hold of that length prices across the county moved about +2.3%, so most of the difference is not the market carrying the house. 2% resold for less than they paid.
Companies bought 15.2% of the 534 homes sold in the Middle Country school district that year (81 of them).
2025 is not a complete year here. Filings reach the state months after closing, so 2025 runs only to October and its totals will keep rising. Its counts are not comparable with a full year; its medians are.
In 2024, 63 homes in the Middle Country school district were resold by a company that had bought them within the previous two years. They were bought for a median of $336,038 and resold for a median of $570,000. Measured house by house, the typical resale was 60% above what that same buyer had paid, a median of 6.0 months earlier.
That difference is gross. Renovation, carrying, financing and selling costs are not recorded anywhere public, so it is the change in price, not a profit. Over a hold of that length prices across the county moved about +4.8%, so most of the difference is not the market carrying the house. 2% resold for less than they paid.
Companies bought 14.5% of the 725 homes sold in the Middle Country school district that year (105 of them).
In 2023, 63 homes in the Middle Country school district were resold by a company that had bought them within the previous two years. They were bought for a median of $305,000 and resold for a median of $520,000. Measured house by house, the typical resale was 66% above what that same buyer had paid, a median of 6.7 months earlier.
That difference is gross. Renovation, carrying, financing and selling costs are not recorded anywhere public, so it is the change in price, not a profit. Over a hold of that length prices across the county moved about +3.8%, so most of the difference is not the market carrying the house. 8% resold for less than they paid.
Companies bought 16.6% of the 730 homes sold in the Middle Country school district that year (121 of them).
In 2022, 59 homes in the Middle Country school district were resold by a company that had bought them within the previous two years. They were bought for a median of $308,000 and resold for a median of $486,000. Measured house by house, the typical resale was 55% above what that same buyer had paid, a median of 6.3 months earlier.
That difference is gross. Renovation, carrying, financing and selling costs are not recorded anywhere public, so it is the change in price, not a profit. Over a hold of that length prices across the county moved about +3.5%, so most of the difference is not the market carrying the house. 2% resold for less than they paid.
Companies bought 11.7% of the 924 homes sold in the Middle Country school district that year (108 of them).
In 2021, 64 homes in the Middle Country school district were resold by a company that had bought them within the previous two years. They were bought for a median of $253,000 and resold for a median of $435,000. Measured house by house, the typical resale was 70% above what that same buyer had paid, a median of 6.7 months earlier.
That difference is gross. Renovation, carrying, financing and selling costs are not recorded anywhere public, so it is the change in price, not a profit. Over a hold of that length prices across the county moved about +6.2%, so most of the difference is not the market carrying the house.
Companies bought 6.6% of the 1,026 homes sold in the Middle Country school district that year (68 of them).
In 2020, 82 homes in the Middle Country school district were resold by a company that had bought them within the previous two years. They were bought for a median of $236,000 and resold for a median of $382,000. Measured house by house, the typical resale was 73% above what that same buyer had paid, a median of 8.0 months earlier.
That difference is gross. Renovation, carrying, financing and selling costs are not recorded anywhere public, so it is the change in price, not a profit. Over a hold of that length prices across the county moved about +9.5%, so most of the difference is not the market carrying the house. 10% resold for less than they paid.
Companies bought 10.6% of the 859 homes sold in the Middle Country school district that year (91 of them).
In 2019, 101 homes in the Middle Country school district were resold by a company that had bought them within the previous two years. They were bought for a median of $225,000 and resold for a median of $367,500. Measured house by house, the typical resale was 66% above what that same buyer had paid, a median of 7.9 months earlier.
That difference is gross. Renovation, carrying, financing and selling costs are not recorded anywhere public, so it is the change in price, not a profit. Over a hold of that length prices across the county moved about +3.7%, so most of the difference is not the market carrying the house. 10% resold for less than they paid.
Companies bought 13.8% of the 975 homes sold in the Middle Country school district that year (135 of them).
In 2018, 108 homes in the Middle Country school district were resold by a company that had bought them within the previous two years. They were bought for a median of $200,000 and resold for a median of $341,500. Measured house by house, the typical resale was 75% above what that same buyer had paid, a median of 7.6 months earlier.
That difference is gross. Renovation, carrying, financing and selling costs are not recorded anywhere public, so it is the change in price, not a profit. Over a hold of that length prices across the county moved about +3.1%, so most of the difference is not the market carrying the house. 11% resold for less than they paid.
Companies bought 15.1% of the 997 homes sold in the Middle Country school district that year (151 of them).
In 2017, 57 homes in the Middle Country school district were resold by a company that had bought them within the previous two years. They were bought for a median of $180,075 and resold for a median of $305,000. Measured house by house, the typical resale was 73% above what that same buyer had paid, a median of 5.8 months earlier.
That difference is gross. Renovation, carrying, financing and selling costs are not recorded anywhere public, so it is the change in price, not a profit. Over a hold of that length prices across the county moved about +4.4%, so most of the difference is not the market carrying the house. 9% resold for less than they paid.
Companies bought 16.0% of the 936 homes sold in the Middle Country school district that year (150 of them).
Source: property transfers recorded with the county clerk, which cover every sale rather than only those listed for sale. Filings reach the state months after closing, so these figures run to October 2025 and describe what has already happened rather than the market today.
Between 2017 and October 2025, 1,241 homes in the Middle Country school district passed between family members rather than being sold — about 19 for every 100 that sold on the open market.
85% of them recorded no price at all, so they appear in no market statistic, no listing history and no sold comparable. They are counted here because the transfer itself is filed with the county clerk, whether or not money changed hands.
Counted from the reason recorded on each transfer with the county clerk, not from the price. Transfers filed only to add or remove a name on the deed are excluded — those are paperwork, not a change of owner. Where a filing gives no reason it is not counted, so these are minimum counts rather than a complete rate, and they run to October 2025.
Of the 54 homes for sale in Centereach today, 17 are now asking less than they originally asked — 31.5%, against 34.6% across Suffolk. 5 sellers have raised their asking price.
And among the homes that actually sold
Among the 201 homes that sold in Centereach over the last twelve settled months, 22.9% had cut their price before they sold — up from 13.7% over the same twelve months a year earlier. The for-sale figure runs higher than the sold figure because homes that need a reduction stay on the market longer, so they build up among the listings still available while the completed sales are led by homes that sold without cutting.
What each group got
Over those same twelve months, the 155 Centereach homes that sold without ever reducing achieved 104.0% of their asking price in a median of 21 days. The 46 that did reduce achieved 95.6% of what they first asked, after 58 days.
Homes that never reduced and homes that did are different homes, priced differently from the start — these figures describe what each group did, not what a reduction causes. How any individual home performs depends on condition, layout, its position within Centereach and how it shows, none of which a market median can capture.
Measured from the OneKey MLS feed, updated daily. A home counts as reduced when its current asking price is below the price it was first listed at — not against an estimate or against other homes. The for-sale figures describe homes available today; the sold figures describe closed sales between September 2025 and August 2026.
What This Means for Sellers
Centereach reads as a Seller's Market: about 2.9 months of single-family supply, and homes sold in a median of 25 days over the past 12 months. If you're considering selling, this market rewards strategic pricing — not overpricing. A properly positioned listing will attract qualified buyers and maximize your net proceeds.
What This Means for Buyers
Buyers in Centereach should be prepared to act quickly and come with strong offers. Pre-approval is essential, and buyers are generally better served retaining their own real estate attorney early to review the negotiation and contract. Expect competition, but don't overpay — there's a difference between being competitive and being reckless.
Thinking of selling your Centereach home?
Town figures are the backdrop. Your street, price band and condition decide what your home would sell for. Start with a value range built from recent sales near you.
Or talk through your timing with us
No cost, no obligation · built from recent nearby sales
Counted over the trailing twelve months: every listing that closed, expired, was withdrawn or was terminated. Listings still active or under contract are not counted on either side. If the feed does not retain every withdrawn listing, the real figure is higher than the one shown, never lower.
Based on information from OneKey® MLS, for the period September 18, 2025 through September 18, 2026.
Flood informationCentereach: FEMA flood dataMedian NFIP cost, single-family homes, ZIP 11720: $960 a year (Aug 2026)
Median yearly cost by FEMA zone: high-risk A zones $2,530 (1 policy, small sample); moderate- to low-risk zones (X, B, C) $880 (25 policies).
Cost trend, Suffolk County
Median yearly cost of single-family NFIP policies taking effect each month.
In Suffolk County, the typical monthly median yearly cost of single-family NFIP policies taking effect in June through August 2026 was $1,410, 14% higher than the typical month in June through August 2025 ($1,230). Based on 6,422 and 6,811 policies.
Check a specific address
Look up the FEMA flood zone for any address: FEMA Flood Map Service Center · FloodSmart (FEMA).
Flood data for Suffolk County: costs by ZIP, trend and FEMA ratings →Calculated from FEMA policy data (as of Sep 8, 2026) and FEMA's NFIP residential penetration rates. Yearly cost is premium plus FEMA fees, single-family NFIP policies only; the insured share is residential NFIP contracts as a share of all residential buildings. Private flood insurance is not included. Not a flood-zone determination, insurance advice or a quote. Each building is priced individually.
What It's Like Living in Centereach
Centereach is one of Suffolk's most established residential communities, offering a distinctive blend of suburban character and metropolitan accessibility. Located in the 11720 zip code, the community is served by the Middle Country Central School District.
With a median home price of $650,000 and a median recorded property tax of $11,600 annually, Centereach pairs an established housing stock with direct access to New York City. The commute to Manhattan averages approximately 84 min via the Long Island Rail Road.
Joseph's Insider Guide to Centereach
Direct answers informed by 5,000+ closed transactions across Nassau, Suffolk, Queens and Brooklyn — not the canned content you'd find on any listing portal.
Is Centereach a good place to live for commuters?
The LIRR connects Centereach to Penn Station and Grand Central Madison in approximately 84 min. Peak express service, station parking and walk-to-station distance vary by address, and those three factors decide what a commute actually looks like day to day.
What are property tax trends in Centereach, NY?
Centereach homeowners pay a median of approximately $11,600 a year in property taxes — the median of the tax figures actually recorded on homes sold here, not an estimate. The bill funds school-district, county, town, and special-district services. Taxes are assessed parcel by parcel, so two similar homes on the same street can carry very different bills — confirm the actual assessment on a specific address before relying on it.
Is now a good time to buy or sell in Centereach?
Centereach is currently a Seller's Market, with homes selling in about 25 days. Prices have moved +6% year-over-year. Timing decisions depend on your specific situation — contact Joseph for a no-cost strategy session tailored to your property and goals.
What makes Centereach different from other Suffolk communities?
Centereach is a long-established community served by the Middle Country Central School District. Prices and activity vary by property type, school district, condition and price band; the figures above show where this market stands now.
What should buyers know before making an offer in Centereach?
School district boundaries in Centereach often run street by street — two blocks can mean a different school zone, so confirming a home's exact attendance zone before you make an offer matters. As an Associate Broker who is also an attorney, Joseph reads title and contract details differently than most agents — and when the facts of a deal are in front of him, he knows what's worth asking about. (Not a substitute for your own attorney's representation.)
Is Centereach walkable for everyday living?
Centereach has a Walk Score of 21/100, measured at a single point near the centre of Centereach. Walkability varies street by street, so check the score for a specific address; the LIRR provides Manhattan access in approximately 84 min.
Planning a Move to Centereach?
Get the Centereach Relocation Guide — schools, commute options, live market data, and insider neighborhood details compiled by an Associate Broker who is also an attorney.
Explore Centereach
The latest from Centereach — local news, community events, and neighborhood highlights.


Schools in Centereach, NY
Centereach is served by the Middle Country Central School District. Attendance zones on Long Island are assigned street by street, so a Centereach mailing address does not by itself determine which school a home is zoned for.
- Elementary
- Bicycle Path Kindergarten-Pre K Eugene Auer Memorial School Hawkins Path School Holbrook Road School Jericho Elementary School New Lane Memorial Elementary School North Coleman Road School Oxhead Road School Stagecoach School Unity Drive Kindergarten-Pre K
- Middle
- Dawnwood Middle School Selden Middle School
- High
- Centereach High School Newfield High School
These are the schools recorded on homes sold in this district over the last 12 months — the district may also serve neighbouring communities. Zones can change and run street by street — we confirm the exact assignment for any home before you offer.
Typical value is the median recorded sale price in the district. Typical annual tax and effective rate are the median recorded tax bill and that bill divided by the median sale price, across 566 recent sales carrying a reported tax figure — an observed cost ratio, not an official millage rate. District boundaries can cross town and postal lines, so always verify the district for a specific address.
See every Suffolk school district, its schools and its tax rates →
School district boundaries on Long Island often run street by street, so a Centereach mailing address doesn't guarantee a given school. We confirm a home's exact attendance zone before you make an offer.
Centereach on the Map
Explore Centereach and nearby areas. Zoom in to see neighborhoods, schools, transit, and local amenities.
Looking to Buy in Centereach?
Browse available properties or let Joseph find the right home for you — with the read of an Associate Broker who is also an attorney.
Homes for Sale in Centereach, NY
62 active listings currently on the market in Centereach. Data refreshed from the MLS in real time.
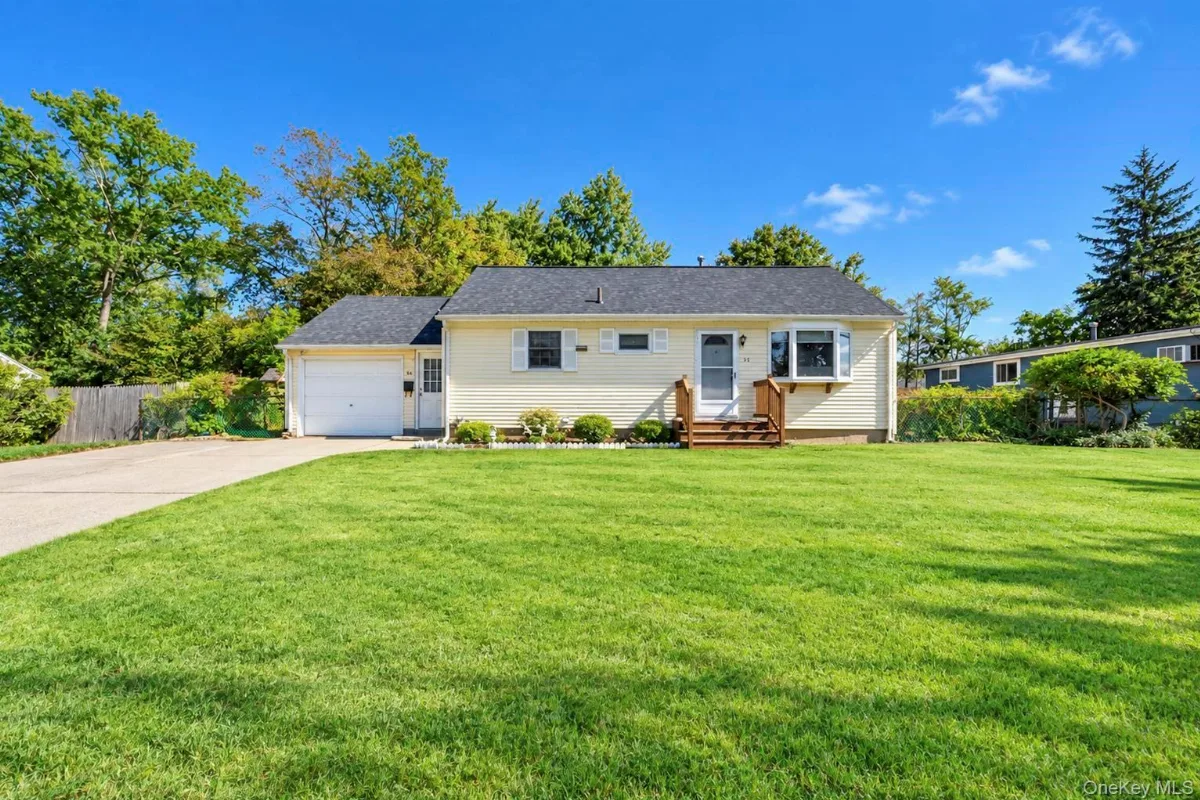 Active 9d
Ranch
Active 9d
Ranch
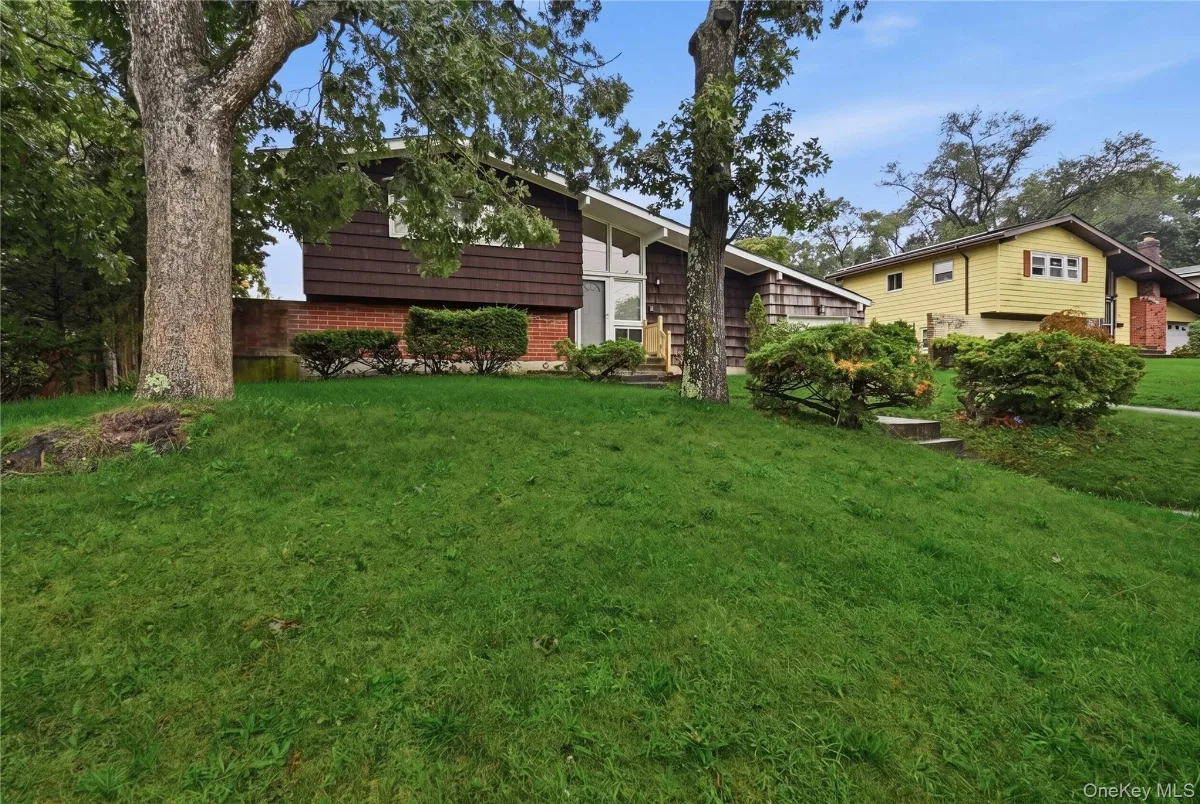 Active 43d
Split Level
Active 43d
Split Level
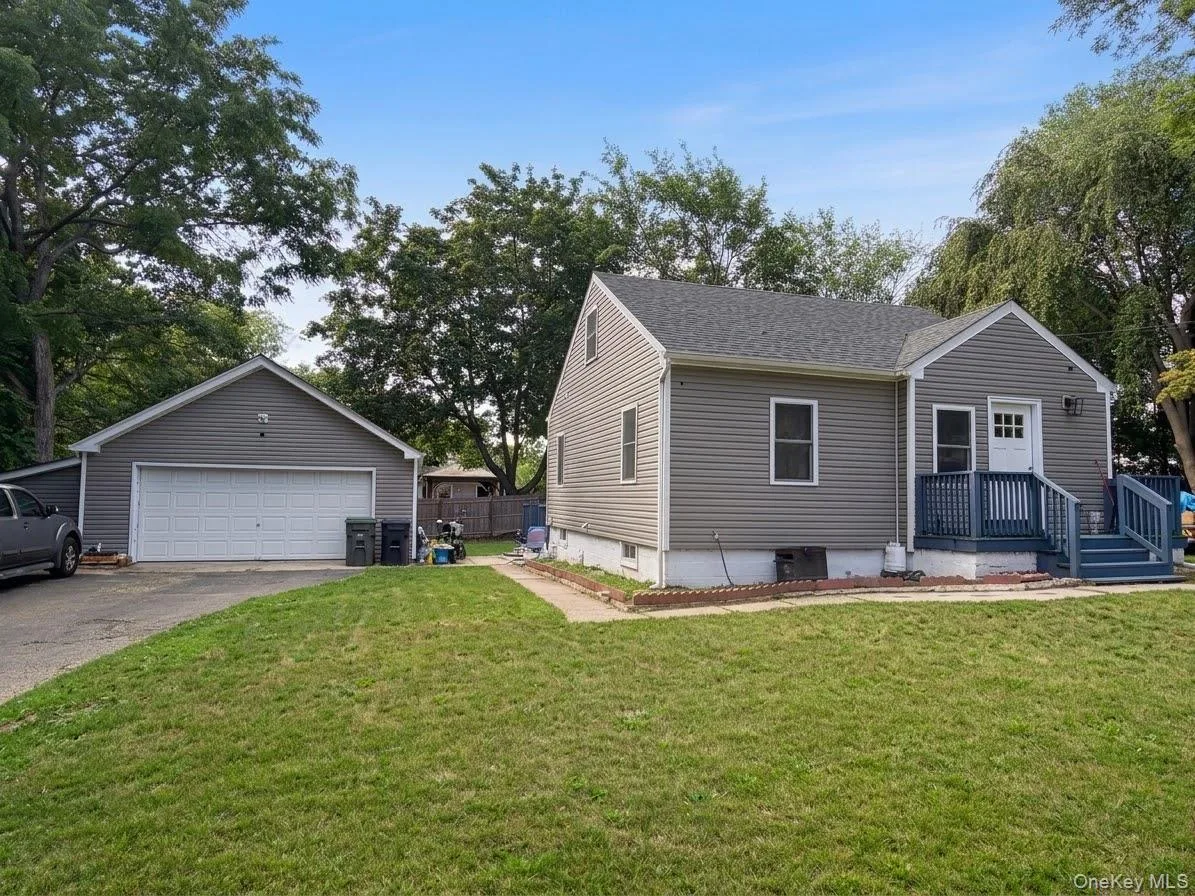 Active 42d
A-Frame
Active 42d
A-Frame
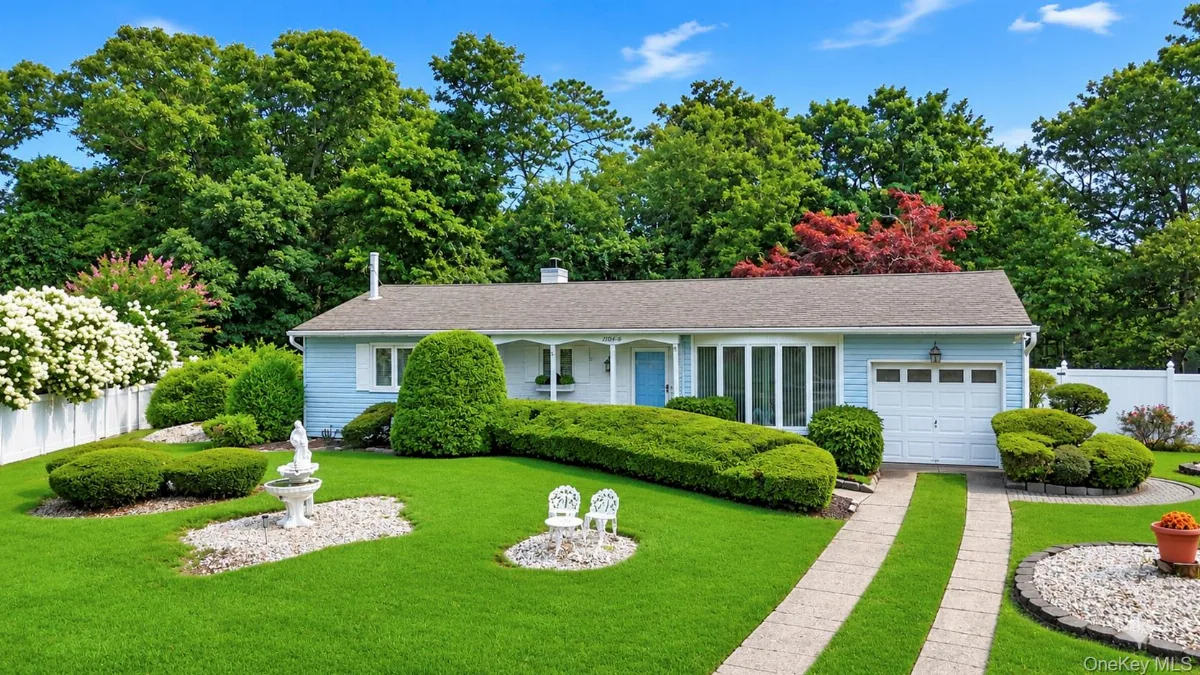 Active 61d
Ranch
Active 61d
Ranch
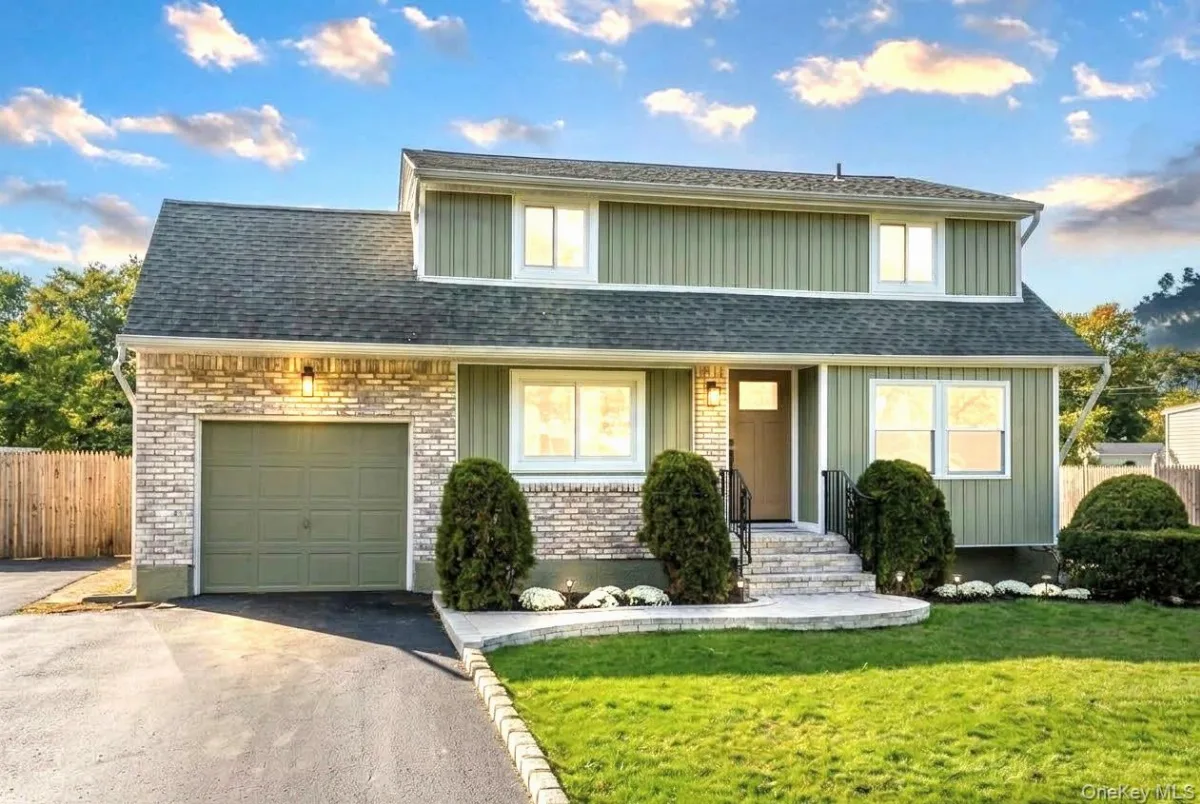 Active 3d
Cape Cod
Active 3d
Cape Cod
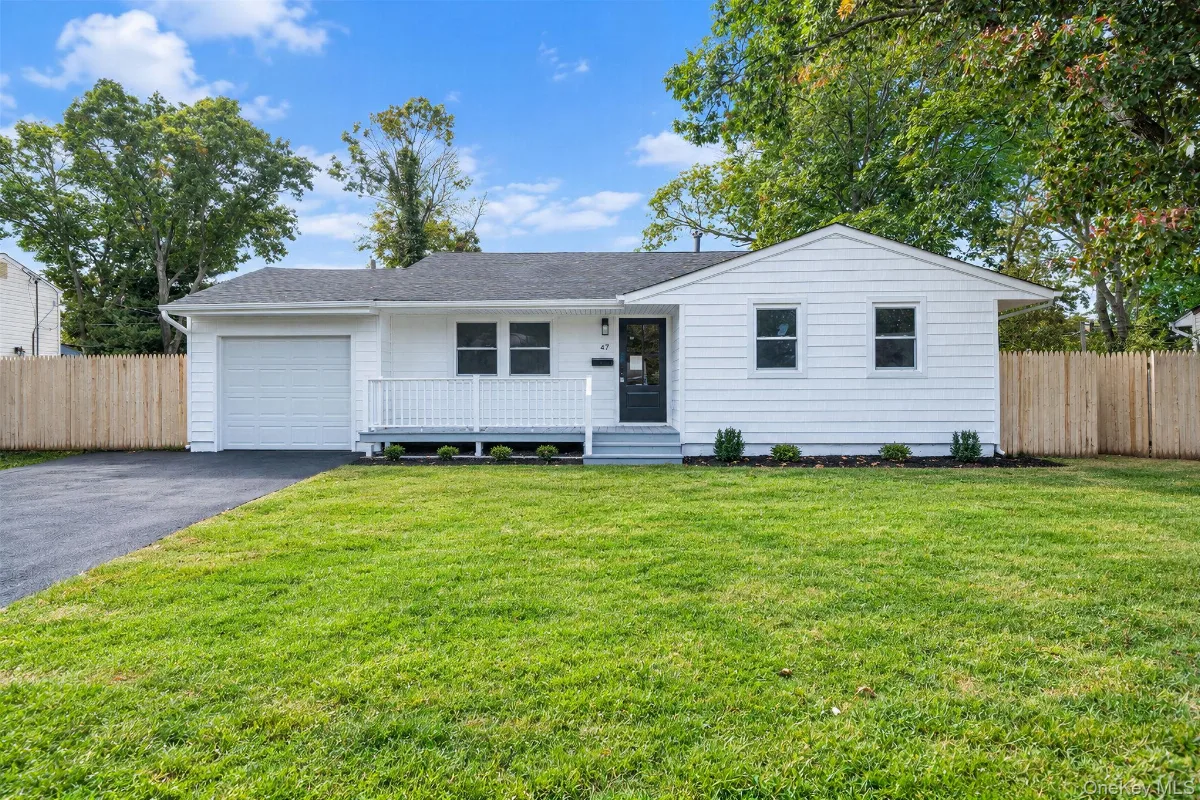 Active 4d
Splanch
Active 4d
Splanch
Listings courtesy of OneKey® MLS as distributed by MLS GRID.
Based on information submitted to the MLS GRID as of October 18, 2026 7:00 am. All data is obtained from various sources and may not have been verified by broker or MLS GRID. Supplied Open House Information is subject to change without notice. All information should be independently reviewed and verified for accuracy. Properties may or may not be listed by the office/agent presenting the information.
Personal-use terms and which listings this site shows: MLS & Data Disclosures
Showing 6 of 62 active listings
View All 62 Listings in CentereachRecently Closed in Centereach
123 closed sales found. Recent transactions provide real-world context for current market values. For a full Comparative Market Analysis of your property, request a complimentary CMA.
← swipe to view all →
| Address | Type | Beds / Ba | Sq Ft | Closed | Sale Price | $/Sq Ft | DOM |
|---|---|---|---|---|---|---|---|
| Hi Ranch | 4 bd / 2 ba | 1,608 | — | Sign in to view | — | 7d | |
| Colonial | 8 bd / 3 ba | 1,560 | — | Sign in to view | — | 10d | |
| Ranch | 2 bd / 2 ba | 1,588 | — | Sign in to view | — | 10d | |
| Colonial | 5 bd / 3 ba | 3,300 | — | Sign in to view | — | 17d | |
| Colonial | 4 bd / 4 ba | — | — | Sign in to view | — | 37d | |
| Colonial | 5 bd / 3 ba | 2,300 | — | Sign in to view | — | 28d | |
| Split Ranch | 5 bd / 4 ba | 2,546 | — | Sign in to view | — | 27d | |
| Cape Cod | 4 bd / 2 ba | 1,428 | — | Sign in to view | — | 24d | |
| Split Level | 3 bd / 2 ba | 1,562 | — | Sign in to view | — | 25d | |
| Ranch | 3 bd / 2 ba | 1,104 | — | Sign in to view | — | 11d | |
| Colonial | 4 bd / 3 ba | 1,887 | — | Sign in to view | — | 22d | |
| Colonial | 4 bd / 3 ba | 2,555 | — | Sign in to view | — | 45d |
Source: OneKey MLS — Centereach closed sales, last 180 days. Verify all figures independently before making decisions.
Get Your Home’s Value →Centereach Real Estate FAQ
Expert answers to the most common questions about buying and selling in Centereach.
How much does it cost to buy a home in Centereach?
Is Centereach a good place to buy a home, and who is it right for?
What are property taxes like in Centereach, and can they be lowered?
What is the LIRR commute from Centereach to Manhattan?
What is the median home price in Centereach, and is it a buyer's or seller's market right now?
How are the schools in Centereach?
Why work with Joseph DeVito to buy or sell in Centereach?
Is Centereach served by one school district, or do buyers need to verify district boundaries?
Which school district is the main draw for buyers looking in Centereach?
Why can two Centereach homes with similar prices have very different tax bills?
How does Centereach's effective tax rate compare with the Suffolk County average?
Is Centereach a buyer's market or seller's market right now?
How many days are homes in Centereach typically staying on the market right now?
What price range sells fastest in Centereach right now?
What is the commute tradeoff for Centereach compared with Selden and Lake Grove?
Do buyers compare Centereach more with Selden or Lake Grove?
Is Centereach a better value than Selden or Lake Grove based on median price and taxes?
How have home prices changed in Centereach?
Are sellers cutting prices in Centereach?
What counts as a price reduction on this page?
Are price cuts in Centereach becoming more or less common?
Do homes that cut their price in Centereach sell for less?
Joseph DeVito is a New York Licensed Associate Real Estate Broker and a New York attorney. He does not act as both broker and attorney on the same transaction: here he acts as a real estate broker only, and he is not your attorney. Real estate services provided through Keller Williams Realty Greater Nassau are not legal representation. Everything on this site is general information for educational purposes only. It is not legal advice, it creates no attorney-client relationship, and it should not be relied on as legal advice — for advice about your own situation, consult your own attorney.
What Our
Clients Say
How Centereach Fits Into the Suffolk County Market
Centereach’s median sale price of about $650K sits about 6% below the Suffolk County median of about $690K. These are whole-county figures over a settled trailing 12 months — the same data behind our full Suffolk County reports.
County medians describe the wider market, not any specific property, and are not a valuation of a home in Centereach.
Markets Near Centereach
The closest Suffolk communities we track, with their current median sale price, median days on market, and market condition — useful for widening or narrowing a search.
Live OneKey MLS medians from recent closed sales, refreshed daily. Market condition reflects months of supply. Figures describe each market, not any specific home.
Didn't find what you're looking for?
Search all Suffolk communities or browse by price range.
Buy or Sell in Centereach, NY With an Associate Broker Who Knows Which Questions to Ask
Joseph DeVito has been part of more than 5,000 closed transactions across Nassau County, Suffolk County, Queens, and Brooklyn. As an Associate Broker who is also an attorney, he reads a deal differently than most agents — and when the facts of your Centereach deal are in front of him, he knows the contract and title questions worth asking.
Also explore: Buyer Resources · Selling Your Home · All Suffolk Communities · Suffolk County Housing Market Outlook · Suffolk County Days on Market Report · Suffolk County School & Tax Breakdown